Category Founder’s Trading Journal

View from The Top Down – 8/1/2021

Priced for Perfection

The Navigator Algorithm system signals appear in the chart above calculated as of tonight with the Globex activity thus far. Note that the “Strength” label continues to flash the yellow warning light. I like to see this at 20 or above. As such, the algorithm has painted a preliminary sell arrow on the chart. This is usually the first warning in the sequence. The bottom line is that I am barely bullish up to the measured move targets right under 4550. We remain in our previous positions, 60% S&P 500, 10% Financials, and 10% Energy. You can be in the cash sectors or options on the SPY, XLF, and XLE.

Having said all of that, and at these levels, the markets are priced for perfection. Some yellow flags in my work are counseling us to be cautious. We need to keep moving our stops up with the 5-day EMA and stay extremely vigilant. Conservative investors should already have their money under the pillow – not in this market.

As communicated Friday morning, the Founders group was stopped out of our S&P 500 futures position Thursday night for a very nice profit. Futures are highly leveraged and must be treated a bit more cautiously than options or cash positions. While we came close to getting stopped out of our remaining positions in the SPY, XLF, and XLE this past Friday on the Amazon earnings miss, the positions held their ground. In fact, the entire session was a dance around our stop line, the 5-day EMA. You can see the details in tomorrow morning’s Pre-Market Outlook.

For the sake of time and brevity, I will flip through the screens from the broadest to the narrowest perspective, referencing the notated charts if you wish to print them. I will be publishing these updated, notated charts nightly on the Website. You will receive a link to view them tomorrow.

Monthly Chart Perspective

  1. The Navigator Algo is in extreme overbought territory on the monthly chart with price closing 18% above the mean, 10% above the Algo Trigger, and above the 3-ATR outer extreme K-Band.
  2. The spreads are historically high, unsustainable and require nothing short of “perfection” in the economy, interest rates and corporate earnings. The situation is comparable to the 2017 blowoff right before the Fed’s last “Taper Tantrum.” As you might recall, the Fed tried to taper the first Quantitative Easing from the 2008 financial crisis and the market went into a 20% correction. This began a 30-month consolidation, also related to the last administration’s tariff policies.
  3. July was the 6th consecutive monthly gain for the S&P cash index. This has not happened in 10 years. Therefore, a 7th bull bar would be even more unusual. Also, we move into seasonal weakness in August and September. Consequently, August should close below its open to form a bear bar and begin some kind of consolidation for at least a couple of months.
  4. Note that similar advice would have failed in August 2017, as the market went into a parabolic blow-off stage ignoring any August/Se[tember weakness. Also note that my similar thoughts about how July 2021 would unfold underestimated the market.
  5. Also note that it is not unusual for the market to skip a deep cut in the first 18-month cycle dip following a severe bear market and a four-year cycle low such as we experienced at the bottom of the bear in March 2020.
  6. Bulls will argue that we have risen out of a 30-month consolidation, with a friendly Fed and a lot of firepower. They will also argue that rotation from one group to the other will keep the market afloat. Yet, that is exactly what can create a lengthy trading range.
  7. All of the important measured move targets from the March 2020 low congregate between 4500 and 4600, so I would be hard-pressed to have confidence above those levels. We could easily be stopped out before we get there, but the probabilities are that 4550 or so is our next destination.
  8. The year-long rally is either a tight bull channel or a parabolic wedge. Because the rally is so strong, bulls will buy the pullback when it manifests, whether it is a 10% or 20% correction.
  9. If the projections are achieved. the market likely will overshoot the top of the monthly micro bull channel, in addition to the 3-ATR K-Bands, increasing the odds of attracting sellers.

Weekly Chart Perspective

  1. This past week was a bear doji bar, indicating nearly equal power between bulls and bears as the week closed near its open. The doji could be interpreted as a weak sell signal bar, and the weekly chart is extremely overbought.
  2. Yet, the S&P 500 has another “V” reversal pattern on the daily chart and there are similar head and shoulders reversal patterns in the Dow, Russell 2000, and other indexes, not to mention some of their key member stocks.
  3. This indicates a high probability of one more push higher into the measured move targets between 4500 and 4600. Beyond that is the 2009 bull top channel line which would require a blow-off of historic magnitude to achieve anytime soon. Achieving the top channel line of the 2009 bull market is not probable without a pullback and some consolidation.
  4. The bulls were not able to create a follow-through bar after breaking into new highs from last week’s outside bull bar. We have had a small pullback trend (micro-channel) for 60 weeks, which is unusual, unsustainable, parabolic, and climactic. This mearly confirms what we see on the monthly chart.
  5. The bulls have the potential bottoming of the 18-month cycle on their side, which could result in a tight trend upward but at a very mild slope. Of course, the cycle may yet to have bottomed. If it has, the cycle low also may help contain a 5% or more consolidation range depending on where the market finally peaks.
  6. A tight bull channel/small pullback trend typically ends with a big pullback. The biggest pullback so far was the 10% selloff in September. A bigger pullback means 15% to 20%.
  7. Traders have bought every dip/reversal for a year. They know the odds are that buying one of these dips will fail soon. However, they also know that it still makes sense to buy them until it stops working.
  8. When there is a successful trend reversal, there is not a consensus that it will succeed until it is already half over. Until there is a strong, clear reversal, traders will continue to buy every 1 – 2 bar (week) selloff.
  9. A small pullback bull trend is a sign of very eager bulls. They are buying small pullbacks because they doubt there will be a big pullback.
  10. Even once there is a big pullback (15% – 20%), investors will still buy it, betting that there will be a test of the old high. Consequently, the 1st reversal down will still be minor on the scale of things, even if it is 20%.
  11. As set forth above, the next targets for the bulls are the trend channel line and the measured move up around 4550.

Daily Chart Perspective

  1. The market held both the 5-day EMA stop and Algo Trigger Line Friday, though just barely. So no sell signal yet, except on an overnight stop that was triggered in the Founder’s Group S&P 500 futures position.
  2. Friday could be considered to have triggered a micro double top sell signal, but it is a low-probability sell signal given Thursday’s bull bar.
  3. There is also an expanding top with the July 7 and July 14 highs and July 8th and 19th lows, and the Emini is near the top of the bull channel, using the May 7 and July 14 highs. Expanding triangles (broadening formations) are trading ranges but can be topping patterns. While you can legitimately draw the pattern on the chart, I believe that the 18-month cycle low on July 19th negates it. Any new patterns should start after that low.
  4. What is more apparent is the “V” reversal bottom in the S&P 500, which is also visible as a head and shoulders reversal pattern on the Russell 2000 (IWM) and Dow Jones Industrials (DIA).
  5. Until there is a strong reversal down, traders will continue to buy the dips and bet on new highs.
  6. The latest bear bars have tails below and small bodies, which means the bears are not selling into the close of bars. They lack conviction and are unwilling to sell low.
  7. Also, there are no consecutive strong bear bars on the daily chart.
  8. Until the bulls aggressively take profits and the bears generate sustained, aggressive selling, the bulls remain in control.
  9. We will maintain our Navigator swing positions in the S&P 500, Financials (XLF), and Energy (XLE) until we violate our stops, achieve our measured move targets, get a solid Navigator Sell Signal, or see a parabolic climax bar.

Sentiment

The one good thing the bulls have on their side is fear. Fear is associated with troughs, not peaks. Friday’s high put/call ratio screamed fear loudly, kept our strategy in the game, and led to an anticipated short-covering rally into the close. More interestingly, the broader and more diversified CNN Fear & Greed Index currently shows extreme fear.

With such extreme fear, and all the weekend headlines calling for a crash, the probabilities favor the market going higher.

Risks and Conclusions

The current breadth and momentum divergences in the major indices could be a warning of trouble ahead. They could also be reflecting the stealth correction in value and cyclical stocks that should be bottoming with the 18-month cycle and perhaps benefitting from some profit-taking and rotation from technology and growth stocks. We need to see how this progresses from the proposed July 19th cycle low before drawing any definitive conclusions. It is on my radar.

The persistent rally in U.S. Treasury securities also remains a concern. This means interest rates have been falling while inflation has remained persistently high, and we are told the economy is booming. As the old saying goes, “this does not compute.”

In the past, the stock market has followed interest rates down with about a three-month lag. We have to watch this relationship between stocks and treasuries carefully. The treasury rally could be an early warning that institutions are battening down the hatches, preparing for a stock market storm.

Finally (and likely related to the rally in treasuries), the Delta variant of the China Virus is a winner in the game of survival of the fittest. In other words, it is a clever and virulent mutation.

In short (and I am not a doctor), the spikes are more efficient at attaching themselves and invading you. This makes it more contagious. For example, if a person with the first strain infected three people, a Delta strain person would infect six. While there is no evidence that the virus is more deadly, it has infected both already vaccinated and younger people – including children.

So far, symptoms have been relatively mild for the young and some vaccinated people. Treatment modalities have improved considerably. Despite this, fear sells everything from website clicks to cable news, elections, and “government protection.” Reliable information and good advice are scarce.

To determine the size of the problem, we need to keep an eye on the Transport Sector (IYT) and the Travel and Leisure Sector (AWAY) for clues as to how this is affecting consumer choices. These two sectors look like they are at the bottom of a waterfall. They are communicating that the Delta Variant is a problem. Then again, sell the rumor buy the news?

The bottom line remains that we maintain our positions with tight stops in a risky and overbought market, intending to achieve the aforementioned targets while proceeding cautiously.

As always, stay tuned.

A.F. Thornton

Mid-Day Update – 7/30/2021

I have only made one round trip this morning for about 10-points per contract. The buys are green, the green horizontal bars, and the sells are the red horizontal bars at the trade locations. I am in a second buy off the falling wedge reversal into the double bottom at 4386 at this writing.

We had a surprisingly strong bull microchannel off the open, and I bought the close of the second bull bar. I sold on the climax bar that broke out of the channel. I planned to buy the first retracement, but the bear bar was too big. Where I sold, you could also have shorted. However, I was reticent to short against such a strong bull opening that filled the entire gap down this morning.

From there, we formed a sloppy, choppy falling wedge, typically a reversal pattern to go higher. There were many scalp trades in that region, but I don’t tend to be a scalper.

The area (also identified as one of our key levels today at overnight halfback) provides much indecision because all the 21-period and Algo lines congregate there from the various upper time frames. Traders have been going back and forth, trying to find the path of least resistance.

More importantly, up around 4394 is where the 5-Day Line (our Navigator Stop Line) and the Nav Trigger on the daily chart sit. We want to close above that level today to stay short-term bullish.

By the way, black bars are down bars; grey bars are up bars. Yellow bars are outside bars, and green bars are inside bars.

So I am currently long against the double bottom and wedge reversal. Today likely will end up a trading range so that the morning high might be the target.

One final, important note. The Put/Call ratio is back above .75. The shorts are not getting what they want so far today. Given that the last hour today is the end of the month and week, we usually get a big move anyway. I will be looking for a potential short-squeeze.

A.F. Thornton

Pre-Market Outlook

Overnight inventory is balanced, and we are currently trading inside yesterday’s range. The daily chart implications are an overall triangle balance area starting with the 7/27 (Tuesday) base between 4416.75 (now the all-time-high) and the low at 4364.75. Then we have yesterday’s (Wednesday) inside Fed range day balanced between 4407.75 and 4377.50. Now we have the overnight range inside both Tuesday and Wednesday’s range and bounded by 4403 and 4480.50.

So what we have is a classic three-day triangle into the GDP and employment reports this morning, which included the widely followed price deflator inflation gauge. That may be why yesterday’s Fed day finished smack in the middle of the range and ended up as a yawner of sorts. With the market still inside this range at this writing, we can take Monday’s approximate 50 point range triangle base and roughly project it from the middle of the triangle.

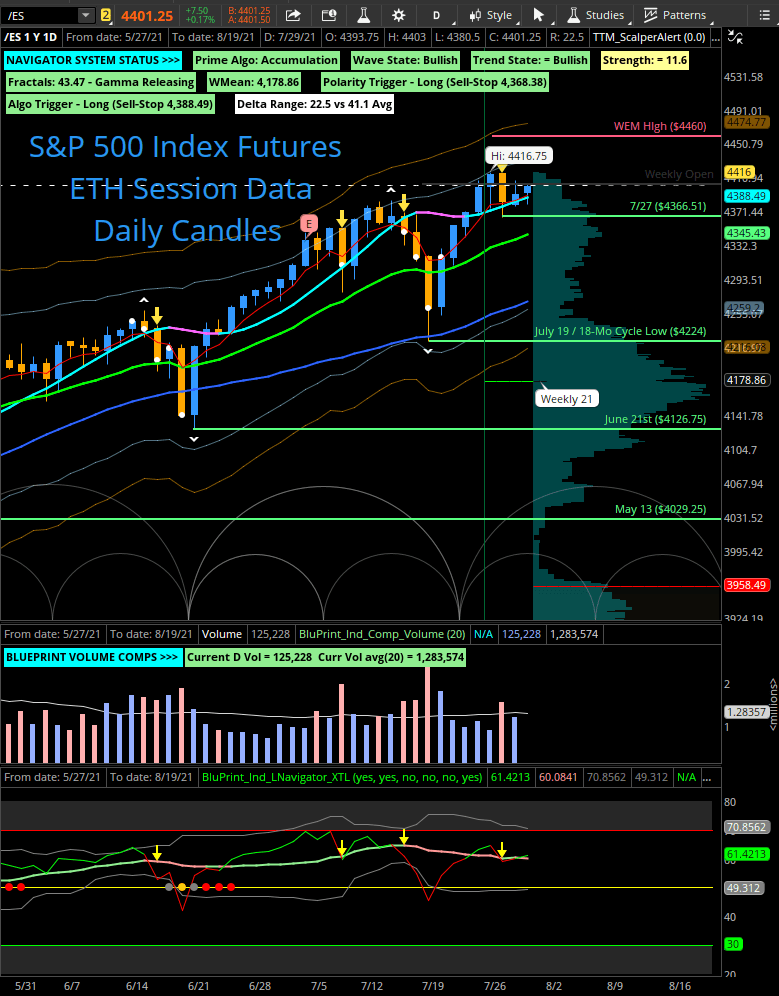
On a break to the upside, we get to a minimum target of 4440, and perhaps eventually to our 4460 Weekly Expected Move high by tomorrow. On the downside, we visit a target of 4340, right below the Weekly Expected Move low at 4346 and close to the 21-day line and mean trading this morning at 4345.

Triangles generally are continuation patterns, so the upside is more likely than the downside. However, an upside break would also take us to the upper three ATR K-Band on the daily chart, an overbought extreme.

On the other side, visiting the 21-day line would not be out of the ordinary either and would complete a two-step corrective pattern off the last rally on the daily chart. But there are other potentially negative chart implications of visiting the 21-day line today or tomorrow to leave for another (hopefully unnecessary) discussion.

I will mention the potential expanding triangle topping pattern that began to form from a 7/2 daily base candle. I don’t think the pattern is legitimate, with an 18-month cycle trough in the middle of it, but I will mention it as a potential carry forward in your narrative. A negative break in the current three-day triangle would force my stops on the Navigator swing trades, a disappointment, to be sure.

Both the GDP and Initial Jobless Claims numbers missed their estimates this morning. That may be good news on the inflation front but less than good news on the economic front. The GDP number missed significantly, coming in at 6.5% versus an estimate of 8.4%. The jobless claims came in at 400,000 versus consensus estimates of 384,000. Continuing claims also are higher than expected at 3.269 million versus consensus estimates of 3.183 million. The GDP deflator came in higher than expected as well at 6% versus estimates of 5.4%. So inflation remains high, but perhaps slowing growth will tame it as predicted by the recent fall in 10-year treasury yields.

At this writing, none of this has managed to move us out of the overnight range, though we are trading in the upper third of the range and near the top. That still gives us no clues about how to trade the open, so it is better to get some price action under our belts before taking positions.

Keep in mind that the weekly open, defining a red or green candle for the week, is 4400.50. That will make the open an important level today. Also, tomorrow is the last trading day of July. The end of the month always results in some window dressing by money managers and sometimes strange market behavior. But there is a positive bias associated with the last few days of the current month and the first few days of a new month.

The bottom line is that Monday’s low at 4364.75 is THE line in the sand. Taking out the ONH at 4403.25 or the ONL at 4380.25 starts the ball rolling in the commensurate direction, then yesterday’s high or low, followed by Monday’s high or low and so on.

I will be using yesterday’s RTH high at 4707.75 as my threshold to look for long trades. As an abundance of caution, I will watch the middle of the range and yesterday’s settlement at 4391.50 as a threshold for weakness to begin presenting for shorts. Whatever the ensuing direction, monitor for continuation.

Good luck today.

A.F. Thornton

Epilogue – 7/21/2021

I was a bit disappointed that we finished in the middle of the range today after the Fed announcement. That puts my guard up just a bit, especially with the sloppy, choppy behavior around 4400 the past four sessions. 4400 also is the weekly open and a big round number. Granted, the market parabolically climaxed at the highs on Friday and Monday and needed a rest. But the expanding triangle visible on the daily chart could be a short-term topping pattern.

Also, just because the 18-month cycle may have troughed on July 19th does not mean that the next 18-month cycle will be bullish. If July is a positive month, that will be seven in a row, which has not occurred since 2010. Notably, 2010 followed a significant bear market low from March 2009, just as we have from March 2020. In 2010, the market peaked its parabolic run off the 2009 bear market low in September and then went into a trading range for a few months.

An 18-month down cycle is my least likely scenario, but I take nothing for granted and want to continue to use the 5-day line as our stop. We do head into potential seasonal weakness in August and September. Eviction moratoriums and Extended Unemployment Benefits expire in a month. There are problems and rumblings in China related to government crackdowns on public companies and a potential real estate and banking crisis. There are rumors that China may devalue its currency – which would not be positive for the U.S. and Europe. In fact, the most likely scenario that would resolve all of the market issues is a trading range of 5% to 10%, like we saw in the fall of 2010.

A trading range would allow for seasonal weakness, support the continued sector rotation, and it could keep the bull market trend alive by sustaining the next 18-month cycle, but at a more reasonable slope. If the July 19th low at 4224 is taken out shortly (not something I anticipate), we would conclude that the 18-month cycle low is not yet in place. If it is taken out in a month or so, perhaps the next 18-month cycle would be bearish.

As you will see from the chart below, today, we sold off from above yesterday’s high but bounced from a small double bottom at the EMA. Then, as anticipated, we entered a trading range before the FOMC meeting, which was a triangle. There was a failed bull breakout and then a weak selloff into the 2:00 pm EST FOMC announcement.

We saw a major bull candle on the announcement, so either a trading range or bull trend was likely for the rest of the day. A weak rally ensued, then reversed from a new high for the session, affirming today as a trading range day.

A.F Thornton


New Buy

The Founders Group added another 10% to our S&P 500 futures position at 4384.50. As always, do your own homework. SPY at the money August or September calls will work as will the shares of the SPY itself.

Our allocation is now 10% XLF calls, 10% XLE calls, and 60% /ES S&P 500 futures.

A.F

Mid-Day Update 7/28/2021

As anticipated, the market is balancing in a triangle pattern so far this morning. The pattern is staying above the key moving averages. That is bullish. A reversal higher head and shoulders pattern is apparent on the 15-min cash chart of the SPX or the SPY. A break above the neckline implies a 35 point move higher to 4440.

Alas, however, there is some bear news. On a 2-hour chart with overnight data, and were the reversal higher pattern to fail, you would see a loosely structured head and shoulders topping pattern of which we would be forming a right shoulder. That might imply a second down leg to a lower low around 4350. Perhaps before reaching that level, we would have a successful retest of yesterday’s low to finish the 5-day cycle tough.

Overall, I am short-term bullish, but the sloppy, overlapping nature of the rally from yesterday’s low looks corrective, not impulsive. Clearly, this could be earnings and Fed trepidation reflecting some indecision. But I cannot exclude the additional down leg possibility.

The market would experience quite a battle trying to invade the territory below yesterday’s low and the 7/14 breakout highs. That should have happened yesterday. Only a negative Fed announcement has the power to drive the market lower at this juncture.

Now you know why I don’t day trade Fed days.

A.F. Thornton

Pre-Market Outlook – 7/27/2021

The market has been extremely bullish, one-time framing higher since the 18-month cycle low on 7/19. That means that we’ve never traded below the prior day’s low in all of those sessions. The market achieved a new all-time high in the overnight session, almost completing the measured move from the breakout range yesterday.

The three key levels today are the new all-time high and overnight high (ONH) at 4416.75, the RTH low at 4397, and the overnight low (ONL) at 4391.75. The overnight low essentially shares the same level as the top of the single prints. Any failure today to cross below that RTH Low keeps the one-time framing going. Crossing below it sets us up for a pullback and could morph into a trading range that balances into the Fed meeting.

The new ATH was made in an overnight session. Carry it forward as insecure. GOOGL, AAPL, and MSFT report after the bell tonight. Together they make up 25% of the NDX. As such there may be some “wait and see” tone to the market today.

With current prices are very close to overnight halfback, there is little to guide us at the open. Higher odds trades will develop later rather than earlier today.

A break of the RTH low would interrupt the one-time framing dynamic, has the potential to attract sellers, or at the very least, could trigger stops. Keep that in mind should the price move towards that point. Target the ONL and top of the single print area and monitor for continuation.

S&P 500 futures are currently down the exact same amount as the NASDAQ 100 futures are positive. That generally doesn’t bode well for any major change in tone.

Good luck today.

A.F. Thornton

Mid-Day Update – 07/20/2021

Looking at the above two-hour candle chart of the S&P 500 Index Futures with 24-Hour Data, you will see that the market has made a symmetrical ABC correction back up to the 5 and 21-day EMAs, also the roundie at 4300 and the measured move off this morning’s break-up from the ON trading range. I rode the Gap and Go trade with two contracts, scaling out of them for almost 59 points. As mentioned yesterday, this volatility can be very conducive to day-trading.

The question now is what to do next. These two-step moves are the hallmark of corrective, as opposed to trending action. If the rally continues higher to maybe a 1.618 move off the “A” to “B” portion of the leg projected from the “B” dip, thereby destructing the symmetry, we can have more confidence in a trend reversal. You can learn more about this by studying Elliott Wave or other materials on corrections.

So this is a critical juncture. I postulated it could take several days to do this, but the market is moving rapidly back to this important level. This could turn out to be a good short, but I would need some confirmation that a turn back down is under way. Internals are very positive today, so an immediate reversal may not be in the cards. I simply want you to be aware of the issue.

When you have a large bar such as the one on the two-hour chart above, it is not easy to be assured that the market is turning down again until the low of that bar is taken out. That would be a poor location to be short from. So I will be watching the lower time frame charts for a turn. The point to get is the importance of the juncture.

Whether or not the intermediate trend has turned down, we could bump along this area until we turn back over for a retest. Incidentally, I forgot to mention that the market also had support yesterday from the WEM low at 4245, so keep that level in mind.

View from the Top Down – 7/19/2021

In this Weekly Series, We Examine the Market From a Big Picture, Swing Trading Perspective. We Use the S&P 500 Index as our Broad Market Proxy, and All References to the Market Refer to the S&P 500 Index Unless Otherwise Noted. The Market Remains the Most Significant Variable in Higher or Lower Stock Prices, Influencing 60% to 70% of Individual Stock Price Movement. The Decision to Be Long or Short Based on the General Market’s Direction is One of the Most Important Decisions Investors Will Undertake.

Bottom Line

We tripped the stop on our 10% position in the XLF (Financials ETF) Friday (6/16), and this was preceded by several Navigator sell signals in the S&P 500 index Thursday (6/15). The XLF was our only swing position, so we are back to 100% cash, but the key question this morning is whether the bulls, once again, will buy the several-day pullback or whether the long-expected, intermediate correction has finally worked its way into the S&P 500 and NASDAQ 100 indexes. 

Arguably, there has already been a stealth correction well underway in many economically sensitive sectors since April – but masked in the indexes by the weighting of a narrow group of large-cap growth stocks. Another rotation from tech and growth back to value and cyclicals could keep the rally alive or at least put the market into a trading range for the foreseeable future. However, we would need to find the bottom of that range in this pullback. 

Sentiment indicators are already showing considerable short-term fear, so I would expect a fairly quick resolution of this first down leg. Unfortunately, that does not tell us where the price will pivot or where we go from there. Watching the Morning Outlook for Day Traders will help you identify the key levels for a turn.

Technical Discussion

Coming from the top of the short-term trading channel on Tuesday (7/13), by Thursday (7/15), the market had closed below the previous day’s close (at minimum a “heads-up” alert). This also generated a preliminary (yellow) Navigator Swing Sell Signal, with further confirmation from a close below the Navigator Algo sell trigger. However, the 5-day line held, if just barely. 

By Friday (7/16), the market closed below the 5-day line, with the weekly bar closing below the prior week’s low for the first time in five weeks (another important “heads-up”). All of this occurred on multiple breadth, momentum, and strength divergences failing to confirm the recent index highs at the channel top, which consummated a selling climax and throw-over at the top of the channel. Our sole position, a 10% position in the XLF, closed below its 5-day line Friday, triggering our stop. This resulted in a small loss and put us back to a 100% cash position in the Navigator swing strategy.

The price action this past week underscored some key takeaways from last week’s View from the Top report. I had pointed out the negative breadth (and other divergences) in a market (using the S&P 500 index as our proxy) that was long overdue for an intermediate correction. The 18-month cycle top still loomed large. At best, though, the cycle bottom has such a time variation that the potential cycle topping zone can only provide some context to what we can currently observe in real time on our screens. 

In fact, I believe that the cycle has been operating stealthily in many sectors since April and may finally be catching up to the major indexes. One expectation I communicated was the unlikelihood of July closing as another positive month, given the statistical probabilities. Naturally, that supposition would need to manifest soon, as we are 2/3 of the way through the month. 

Also, I have been pointing out the Butterfly harmonic sell pattern in the NASDAQ 100 over the past few weeks. As the NASDAQ has been the recent market leader, its breakdown from the pattern would be a negative development for the broad market. 

Finally, I pointed out the rally in defense/risk-off sectors and asset classes, such as treasuries, as eerily similar to signals I observed in January 2020, right before the China Virus crash. While not predicting a crash, I pointed out that the rally in stocks and treasuries basically was a contest. Only one of these asset classes could be right in the current circumstances.

Nevertheless, I also pointed out that the relentless bulls would continue to buy one to three-day pullbacks until such buys stopped working. This morning, we will get a chance to test the bulls, as the market is trading such a pullback right to the 21-day line. The 21-day line typically divides the short-term up or downtrend. It also provides support for the market more often than it doesn’t. After that, more support congregates around the 50-day line.

If you backtrack several months, you also will see that most of our pullbacks this year have been right at this same mid-month period into monthly options expiration and only lasted a few days. Friday was monthly options expiration, in addition to weekly. 

Recall that the June pullback on quadruple expiration Friday left a scary bear bar closing at its low and below the 50-day line, only to see the bear breakdown fail the following Monday. The market followed through and continued the next bull leg up through last week. The bulls will be similarly tested once again today.

Also supporting the bulls, the CNN Fear Greed Index (above) is down to 23, and the CBOE total put/call ratio (below) spiked again on Friday. So sentiment would support a short-term low and turnaround here, though there is no indication whether the 21-day line will be good enough for a pivot point or whether we will need another trip to the 50-day line or some other level. 

And even if the market turns quickly again, there is no assurance that the trend will resume. Recall my prediction in the last writing that a trading range is a highly likely outcome of the bull micro-channels breaking down on various time frames.

A Shot at the Fundamentals

I still ponder the question, why are interest rates falling and economically sensitive stocks weakening? Three issues likely form the heart of this current market dissonance. 

First, inflation is devastating the purchasing power of individuals. My wife has been in Greece for five months, but for a few days when she came home, and all of us had to return when her father took an unexpected turn for the worse. My wife is a very conscientious consumer. Yesterday was her first trip to the grocery store since this past February. Needless to say, she was shocked by the prices.

Inflation is a deadly, ominous hidden tax that angers me to my core and hurts those at the bottom of the economic ladder the most. This administration promised to help those at the bottom, not hurt them. One only needs to look at the price of housing, gasoline, and food to ask the question, how are the current policies working for the poor and middle class? 

If the Fed isn’t in the pocket of the current administration, it will begin the process of reversing its dubious, inflationary monetary policies soon, and the markets may be anticipating the end of the liquidity party.

Second, the extended unemployment benefits end in September. As well, many of the mortgage, rent, and other debt relief programs will expire soon. The transition out of all of these subsidies has to be a concern to current market participants.

Finally, we are experiencing a third China Virus wave with cases increasing daily. As it is called, the Delta strain is apparently quite virulent, highly contagious, and vaccine-resistant. More masks? More lockdowns? More shots? Who knows, but sometimes the fear of something is worse than the something itself, at least for the financial markets.

Any combination of these fundamental factors could be the catalyst for a one to three-month, intermediate correction, long overdue in this market. I patiently await this correction to aggressively deploy capital. I have done this too long to plunge in near a top, no matter how good it looks. We just got stopped out of the XLF, even though we kept the position small and bought it after nearly a 6% correction and double bottom off the trading channel. So just because something is low, does not mean it cannot go lower.

Conclusion

This week, I have shifted my stance from “neutral to bearish” to “bearish.” Really, my opinion does not matter. The change in my position telegraphs that I want to go back into the market on a good downdraft instead of a minor one. I need to see a true correction and pivot on the daily chart to garner my interest in a swing position.

While we should get a short-term turnaround or bounce today or tomorrow, that may be a time to raise cash. Markets rarely form an upside down “V” top. Usually, they will climb back up one more time and either test the old high or fall slightly short of it, if the intermediate correction is finally underway. The evidence is mounting that the trend is (at the very least) transitioning sideways, if not into the anticipated full-blown, intermediate correction.

During this period of unusually high risk these past few months, I have been quite satisfied with day trading, as opposed to holding overnight positions. Watch the Morning Outlook for Day Traders, updating three times daily, for guidance. However, paper trade for a while before you plunge into day trading. Day trading has its own foibles to challenge us.

I am understandably frustrated that stops and sell signals were taking place on the two days I was stuck in airports and on airplanes traveling, though I did my best to drop a few paragraphs to keep you updated. I was on a single, direct plane flight for nine hours on Friday between Frankfurt and Denver when the most critical market violations occurred.

What I find difficult (and have these past few months) is that while our swing-trading sell triggers have been excellent, the need to turn around and reenter on a buy signal almost instantly and in such an overvalued market is not so easy to execute, especially having just exited a few days earlier. If that becomes necessary here, it won’t be easy either. Every step higher in this market involves increasing and considerable risk.

If you still hold some XLF, you can see if we get a turnaround today with the bulls, but I have learned over the years to be rigid with my stops even though we get whipsawed once in a while. The XLF was doing all it should until Friday, when it got caught up in the widespread selling. That was my one fear in taking the position.

Patience is a virtue here. As always, be careful.

A.F. Thornton

Brief Comments – 7/15/2021

I am in an airport and posting from my phone, so this will be brief. As to our core S&P 500 market proxy, while there was some selling in yesterday’s regular session, the value area remained completely unchanged. Prices did not test the overnight low. Today we have an overnight session somewhat weaker which has taken out that prior Globex low but is currently trading above it and just inside of yesterday’s regular session range.  

Given the current price level, Balance Rules will be in play this morning, as will Gap Rules if we open below yesterday’s regular session range. From there, I would evaluate the morning session as follows:

  • The first order of business will be to see if prices open on a true gap or not.  If so, given that overnight inventory is 100% net short (give or take a few ticks), the propensity for short-covering exists. 
  • If we open within range, then there is no true gap, and we should assume that short-covering is already underway.  If so, yesterday’s regular session low will be the important key level to discern if we are trading in or out of balance and will be my bull/bear line in the sand for today.  
  • On any strength, assume yesterday’s POC is the target.  This is the obvious high volume node that should serve as any upside magnet.  
  • Any acceptance below yesterday’s regular session low would indicate a potential for a “look below and go” as per the balance rules. If so, target the Top of the Single Prints first and monitor for continuation. Tempo and tone will have a lot to do with whether or not this happens as will any divergence between Nasdaq 100 and S&P 500.  The market will need both sides to be selling for any real follow through to occur.

AF Thornton

Subscribe!

Free Blog content and videos delivered to your email.

Health and Wealth Podcast Coming Soon!

We value your privacy, never sell your information, and detest spam!