Epilogue – 4/8/2021
The slop fest chop continued through to the close, not an ideal scenario for day traders, right? Well, that depends. Let’s review where we started this morning.
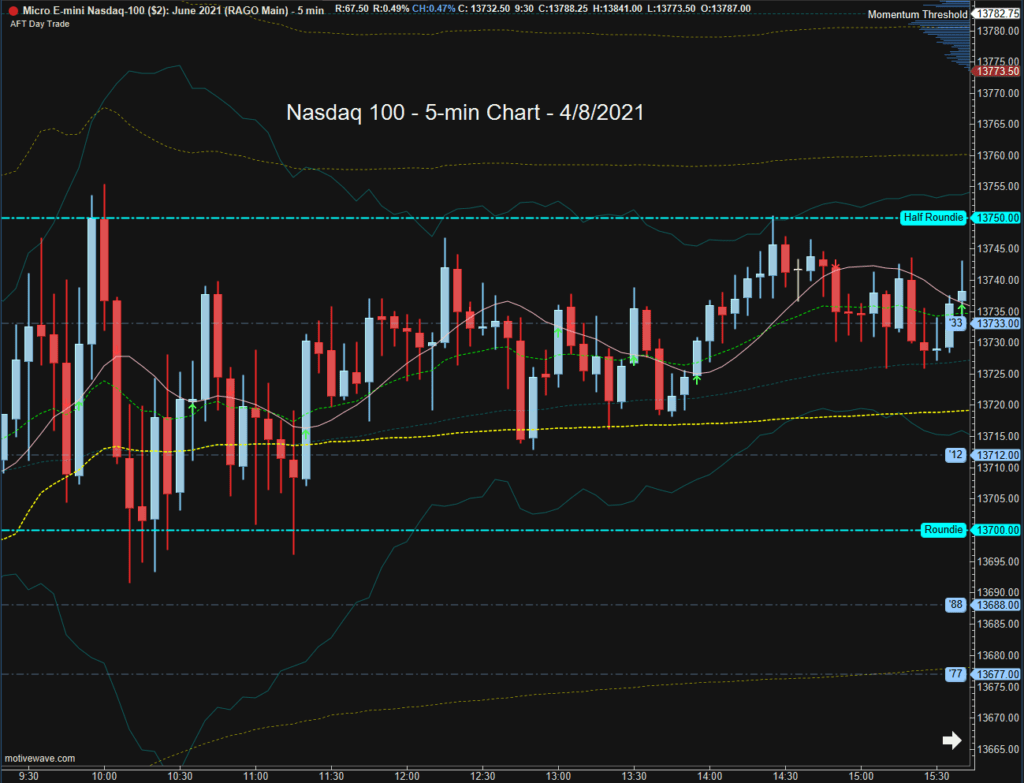
After large gaps at the open such as this morning, Gap Rules caution us that such large gaps often fail to fill on the first day and can be difficult to trade as the markets digest the overnight gains. Moreover, I cautioned that one way to assess the likelihood of a Gap and Go scenario versus chop and digestion is to assess market internals at the open. Today, market internals opened both weak and mixed, almost ensuring sideways price action – otherwise known as balance. The NASDAQ 100, which I will use as my example, gave us a classic, balanced day.
When I write about expectations for balance – this is what balance looks like. When I discuss “responsive” trading, I am referring to trading from either end of the balance range. In other words, traders “respond” to the edge of the range, not hesitating to take long and short positions throughout the day.
Today, you got to observe the potential for responsive trading in a balanced session firsthand. Your assessment skills in early trading can be critical to the outcome. Today, I dropped $300 on my first few trades before making the correct assessment and righting the ship. It goes with the territory.
Knowing you are trading a balanced or trading range session, what can you do if you feel the need to trade? Personally, I prefer to skip these days once assessed – but there are a couple of other choices.
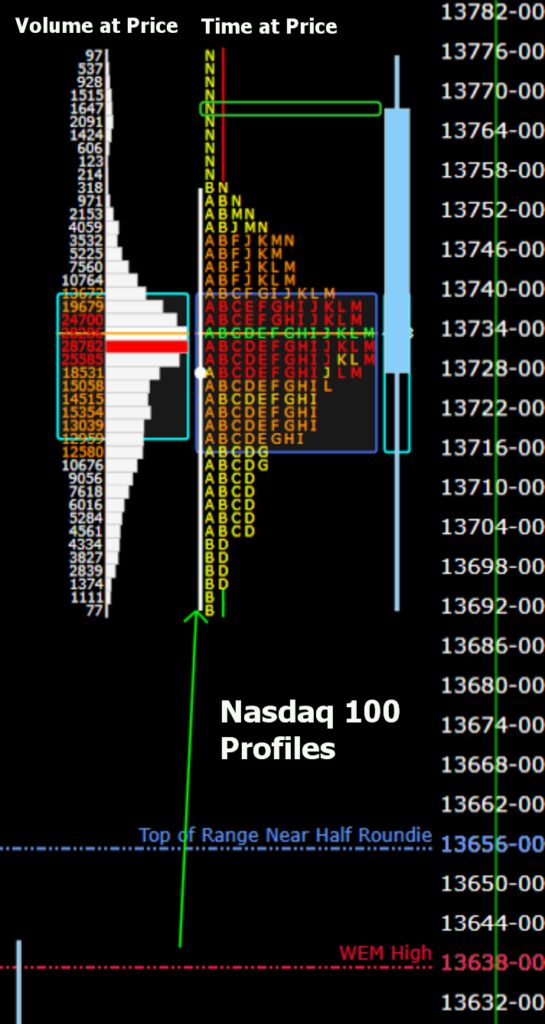
Looking at the NASDAQ 100 from the market/volume profile angle – you have the classic bell curve. Note that the volume histogram (number of contracts traded) dries up as the price rises or falls. Today, 13733 is where the most volume occurred and the most time was spent, making it the fairest price of the day. Traders were unwilling to expand the range in either direction.
That is how the auction process unfolded today, and the chart below gives you the proper visual reference. Traders explored both directions but landed in the middle.
Once you see the bell curve forming and you have established the initial range on the minute chart, you fade either end of the range/profile back to the middle. In other words, you trade the range. You can use the value area high and low to initiate long and short trades, as the case may be. Today, the value area (rectangles drawn on the profiles above) was not that wide, but it can be extensive in other sessions.
You can draw a rectangle around the traditional price chart range and trade it from that perspective, perhaps riding from the range top to the bottom. However, top to middle and bottom to the middle is the safest, most conservative trading strategy.
Always pay attention to key turn-times throughout the day, as a rally/decline to break the range could start at such times. Monitor for improving internals to assess the likelihood of a break. Make sure you look at a heat map of the S&P 100 to see if the large-cap leaders can overcome a negative advance/decline line. Also, note the yellow line on the traditional chart above. That is the volume-weighted average price, also a key level to cover trades initiated from either end of the range.
One final way you can trade such days (once the volatility calms down an hour after the open) is to drop down to a 1-min or 2-min chart, then use the Algorithm Trigger for entries and exits, perhaps trading more contracts since the range is limited. Any combination of these methods can filter and take the best trades.
By the way, never underestimate the value of observation. At the end of each day, study a 5-minute chart for the day. Where were the turns? What time? What did the turns look like? What were the internals doing at the time? Before long, you incorporate the information into your brain, and the moves become intuitive.
The range today where 70% of the volume occurred essentially tilted upward from 13700 to 13750. Recall that the market progresses up and down, stalling and fighting at these 50 point increment levels. Always carry that forward. Step back and look at where you are and where the market is trying to go – when the market is encountering support and resistance. The information can be helpful to your confidence.
Perhaps the most important Market Generated Information to add to our bullish narrative today is that the markets held above their gaps, and traders accepted prices there. This helps bury the options market makers before tomorrow’s expiration and could force them to buy more futures as any hope of maintaining price within the Weekly Expected Move range may be dashed.
On the negative side, the volume was light again today, and there are some strange Intermarket relationships I will discuss tomorrow. Also, all the unfilled gaps below us will act as air pockets in an intermediate decline. That is when you need your parachute if you were not lucky enough to timely exit your positions.
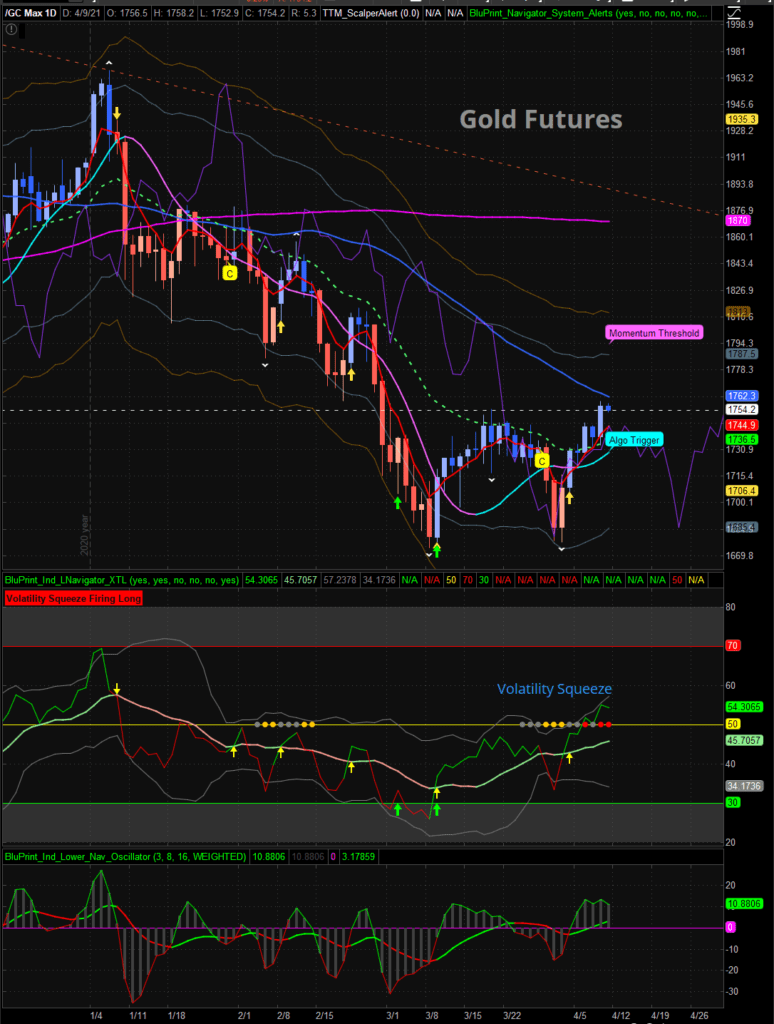
Notably, today, gold is in a volatility squeeze, coming off an “h” reversal pattern. I am keeping a close eye on it. A countertrend trade up the channel can be very profitable off a volatility squeeze.
You can see what the squeeze has done for the NASDAQ 100 and S&P 500 over the past week, and perhaps Gold will follow suit. Gold can be a crazy character at times, but it is still worth throwing the line in the water. In the swing strategy, we increased our position in Gold today to 10%.
Still, we sold the remainder of our equity positions at the open today, anticipating a small cycle pullback into early next week and cognizant of the nominal 18-month cycle looming over us. That cycle could last another month before it peaks, or it could peak next week. We don’t know but carry it forward in the narrative.
Finally, I am a bit perplexed by Oil and Energy (XLF) failing to lift off with the rest of the risk assets recently. With Gold rising, Oil stalling, and a lousy employment report today, my WWSHD (When What Should Happen Doesn’t) needle is spinning.
A.F. Thornton

Related Posts