It can be difficult to know where you are going if you don’t know where you are. I will be covering this in more detail in the video I hope to finish today. As today is a Fed meeting, I won’t be trading.
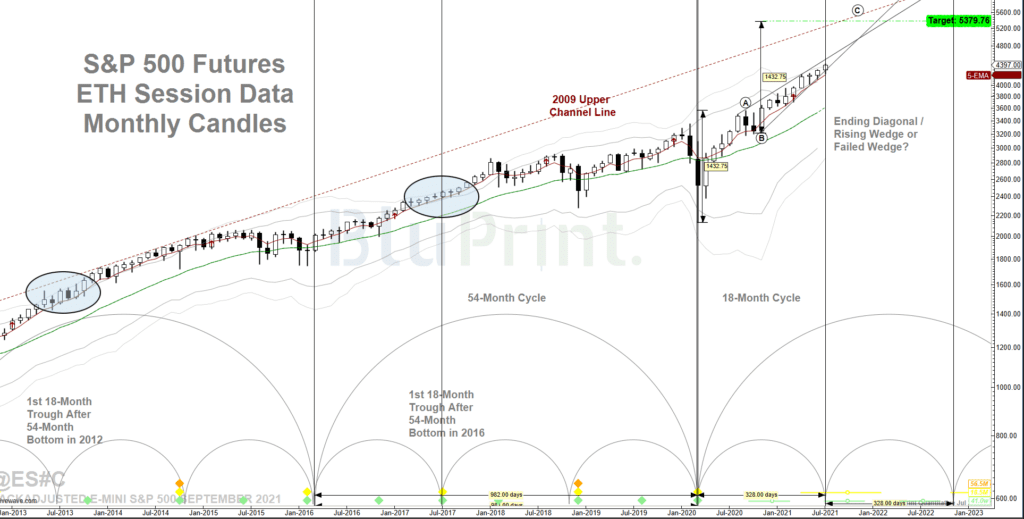
I hope you will glean from the monthly chart of the S&P 500 index above that we just bottomed the 18-month cycle on the 19th (last Monday). And because we launched a new, 54-month cycle at the pandemic low in March 2020, the trough is barely noticeable, just like the last two similar spots in 2013 and 2017. The broad market peaked in April and should be bottoming here as long as the low at 4224 on the continuous futures contract, and 4233 on the cash index holds. Since the market has been rotational, we have to move back and forth between the various sectors in and out of favor.
You will also see from the chart above that we are headed for the top channel line of the 2009 bull market. Whether you project the channel line, or the A leg of the ABC pattern leading this market, the projection is roughly 5380. It all depends on how fast we get there, but I expect a less steep slope going forward, with some additional consolidation ranges. A normal slope is an angle of about 15%.

Drilling down to the daily chart above, we can make some short-term projections that should take us to our next target, around 4500. We already achieved our first target at 4404 before yesterday’s dip and retest. I also included a comparison, lower graph showing the percentage of NYSE stocks above their 50-day moving average. It does a better job of capturing the broad market, 18-month cycle trough.

Drilling down one more level to the two-hour chart, we see a bit more detail. Yesterday’s dip came right on schedule for the 5-day cycle. You can see the cycle toping on the lower momentum/strength chart ahead of the dip. The market behaved normally, and volume barely picked up on the dip. Once again, you can see the projected targets from the various recent ranges.
With the Delta China Virus variant rearing its head, it is doubtful that the Fed will raise rates. Most indicators, especially the 10-year treasury rate, are projecting some slower growth ahead, which should satisfy the Fed. Of course, rates could bottom again here, as we see the next rotation from tech and growth back to cyclical and value. A lot depends on this latest China Virus scare.
Again, I will cover this in more detail in the video. But at least this discussion gives you the big picture. The July 19th lows mentioned above are the line in the sand. We have moved the Navigator swing strategy long against this low. We are hoping to pick up a rotation back into financials (XLF) and energy (XLE), but the Delta variant will have a big impact on whether or not that materializes.
AF Thornton